
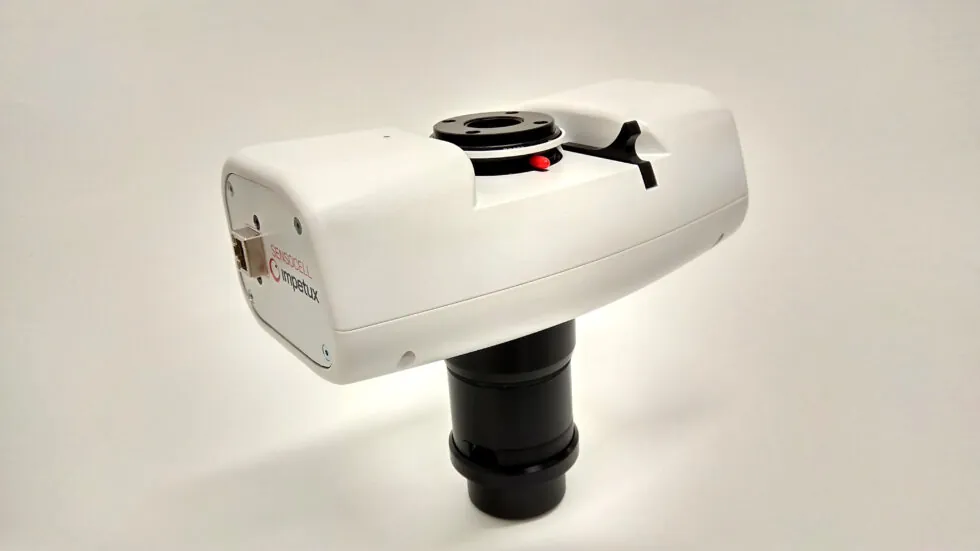
Discover the unique advantages of our force spectroscopy module integrated in SENSOCELL optical tweezers.
Our products represent a breakthrough in how optical tweezers force measurements are performed, enabling and making simple unprecedented experiments where traditional trap stiffness calibration fails:
Direct force measurements are independent of sample & medium properties and can be easily performed even inside complex viscoelastic media like living cells & tissues.
Optical trapping forces can be measured on irregular & non-spherical objects such as micro-cylinders, rod-shaped bacteria or cellular structures like cell membranes.
Our unique force sensor allows measuring forces beyond the trap stiffness linear region (F=k·x) meaning that, for a given trapping laser power, higher forces can be applied and measured with respect to other standard methods what allows minimizing irradiation doses on your samples.
The Lunam force spectroscopy module from Impetux now forms a key component of our TIRF-tweezers microscope at the UKRI Central Laser Facility. Impetux have provided a robust and accurately calibrated force measurement module that can be synchronised with video acquisition and stage control. This is now attracting greater interest from our academic communities for studying both physical and life sciences.
Andrew Ward
Division Head CLF Lasers for Science Facility, Science and Technology Facilities Council, UK
The key of our technology is that it measures the force as a derived magnitude of the direction of propagation (momentum) of the laser trapping beam. The analysis of laser trapping light momentum changes provides a direct route to the force. Hence, unlike other systems based on regular back focal plane interferometry or video tracking our force sensor allows measuring forces without requiring any previous trap stiffness calibration or any sample position tracking.
This gives our technology a key advantage for measuring forces in complex media like cells or biological tissues since no restrictions on the sample are imposed.
A force measurement instrument for optical tweezers based on the detection of light momentum changes
Initially developed by Carlos Bustamante’s lab (Berkeley University), the momentum method was originally applicable only to a counter-propagation optical trapping configuration where two counter propagating laser beams are used to compensate the axial (z-axis) scattering force of light.
IMPETUX’s force sensing technology overcomes this limitation and allows implementing the momentum method for standard optical tweezers configuration force measurements.
Contrary to other existing commercial solutions, the calibration of our light momentum-based sensor is a one-time event since it is only dependent on the optical and electronic specs of the sensor itself.
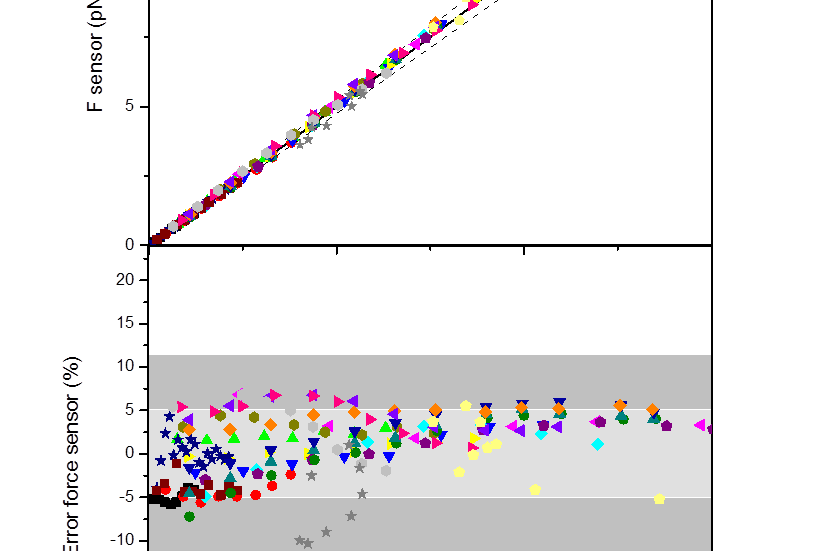
Made at factory, each sensor calibration is unique, constant and permanent. Direct force measurements are therefore possible without needing any prior calibration independently of sample and medium conditions with great accuracy and repeatability.
Measured force vs. theoretical force, derived from Stokes equation, for different samples and medium conditions (top) and relative errors for all data. Data colors and symbols refer to each different experimental conditions:
Samples: microspheres (d=0.5 – 5 µm, n=1.46 – 1.59), micro-cylinders (L=10 – 50 µm; d=5 µm, n=1.52) & purified lipid droplets (d=1-3 µm; n=1.52). Medium: pure water (n=1.333) and water like medium (n=1.348 – 1.364). Laser trapping: perfect Gaussian & aberrated beam
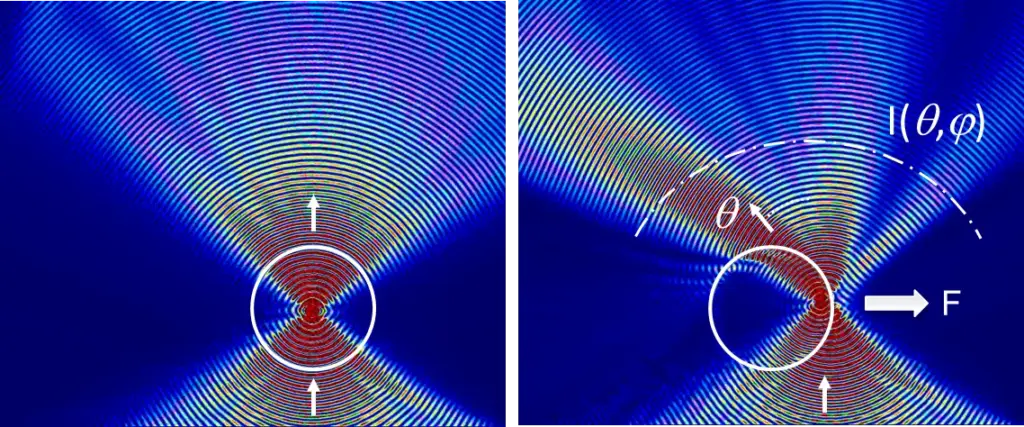
Simulation of the beam light propagation path for a trapped centered (left) and off-centered (right) microsphere. In the first case there is no net restoring force since the mean value of the forward scattered light deflection angle is zero. In the second case, <sinθ>≠0, and there is a net restoring force acting on the bead: F=n•P•<sinθ>/c.
Our force spectroscopy sensor can be installed and set in operation through a simple procedure even by non-expert users. Check the following videos for instrument installation and height adjustment. To see the force sensor in action check the video demonstrations in the SENSOCELL product page and our applications pages.
The force sensor substitutes the illumination condenser, without affecting the imaging capabilities of the microscope. It can be installed in a very simple and fast way by a single user without any required expertise. Adjustment of the sensor height is straightforward thanks to the integrated iris used as reference.
All our systems have been designed with the utmost quality in mind. High reproducibility in the results is provided thanks to the implementation of systematic routines in the operation of the force sensor. The sensors incorporate immersion optics for maximum signal sensitivity, especially when working with small samples or at low powers. The integrated analog and digital electronics, featuring high-resolution A/D converters ensure acquisition fidelity. A careful design guarantees mechanical stability and easy installation.
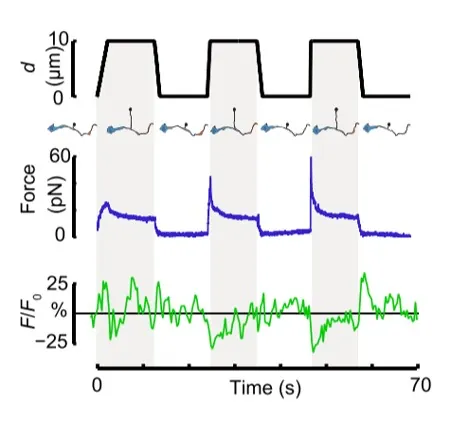
Time dependence of trap position (top), force signal (middle) and Ca2+ fluorescence signal (bottom) recorded during a membrane tether pulling experiment. The force and Ca2+ ion channel activity signals exhibit negative correlation.
Force and displacement data for two beads stimulated at frequencies of 4 Hz and 0.25 Hz. The progressive reduction of the beads displacement is in concomitancy with an increase of the applied force and loading rate.
Schematic representation of the optical tweezers experiment. A fibronectin-coated bead is trapped, brought into contact with the cell membrane and stimulated with oscillations at different frequencies.
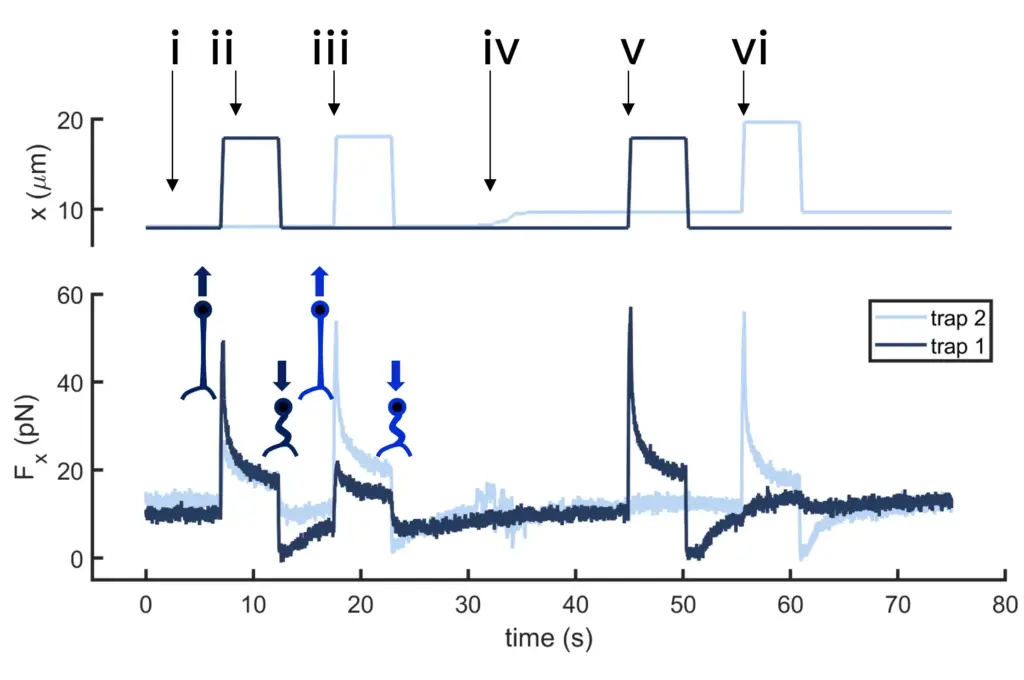
Time dependence of trap 1 and trap 2 position (top) and force (bottom) data along the different steps of the described dual tether pulling experiment.
Confocal video of the described dual tether pulling assay performed on a neuron axon. Courtesy of M. Krieg lab (ICFO).
Time dependence of trap position (top), force signal (middle) and Ca2+ fluorescence signal (bottom) recorded during a membrane tether pulling experiment. The force and Ca2+ ion channel activity signals exhibit negative correlation.
Confocal video showing a DVA neuron Ca2+ ion channel activity in a dynamic optical trapping assay. The pulling rate applied to the membrane tether is progressively increased. Scale bar = 5µm. Acquired at 10Hz.