Our advanced optical trap generator based on ultra-fast AOD technology.
Versatile and flexible optical trap manipulation designed for biological samples
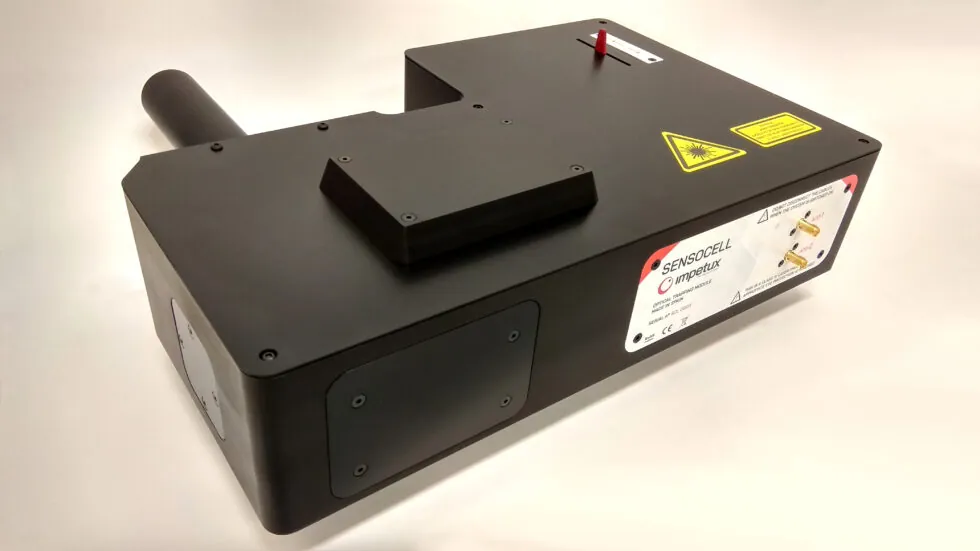
We present you a compact and robust optical trap generation module conceived as a satellite instrument for Nikon inverted optical microscopes. Enclosed into a high-quality aluminum box and assembled onto the microscope body, its design minimizes the impact of any instabilities of the optical table and assures the maximum mechanical stability of the system and lowest drift.
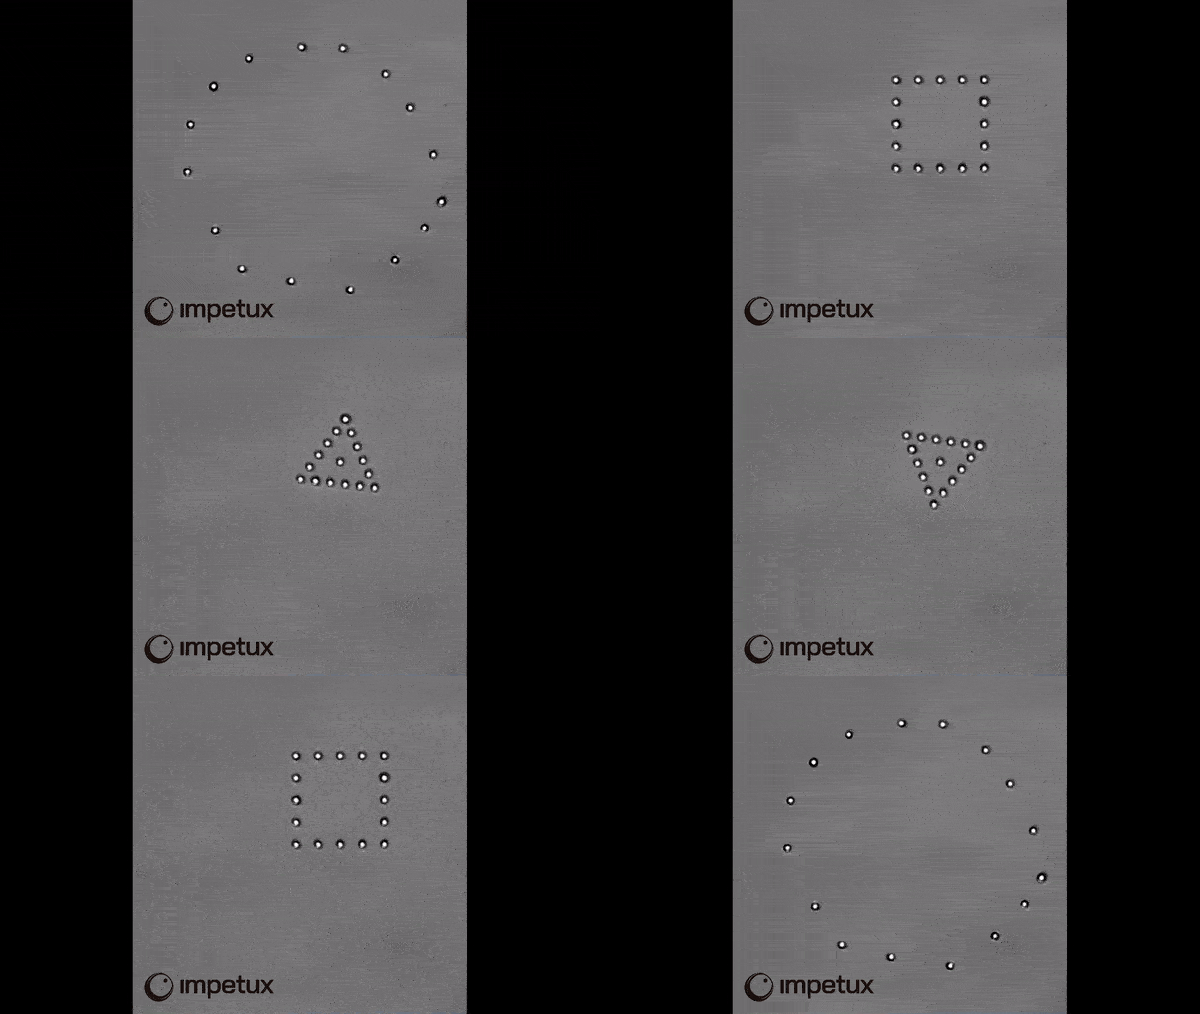
Generation and manipulation of multiple simultaneous traps (up to 256 optical traps).
Optimized optical design for an excellent optical trapping efficiency.
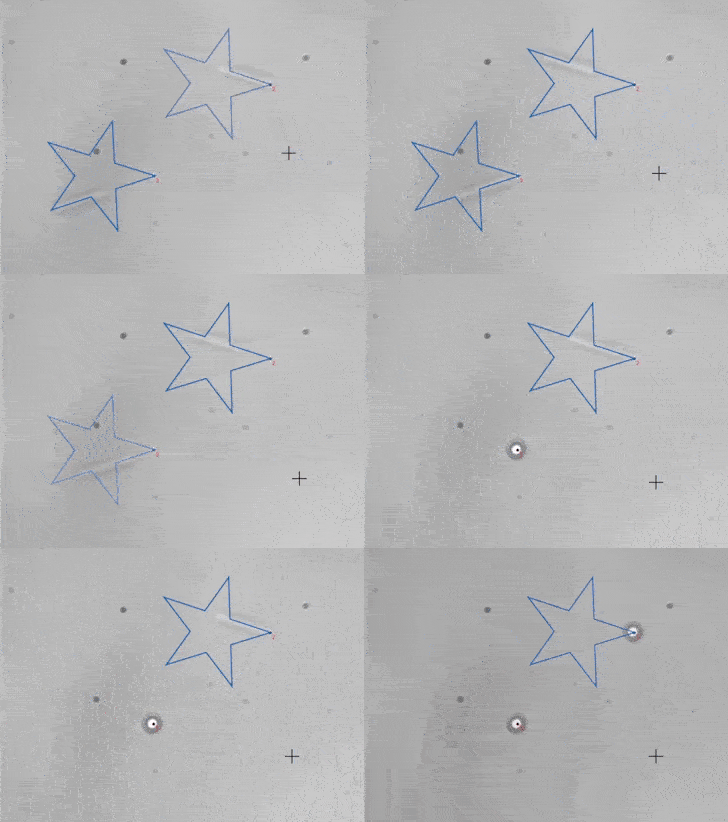
Extensive and versatile manipulation. Trajectories, oscillations, pattern morphing…
Based on acousto-optic deflection technology.
Ultra-stable low noise infrared laser for biological compatibility included (1064 nm, 5W power and <0.3% long term power fluctuations).
Compatible with different imaging techniques including BrightField, epi-FL, TIRF or Confocal microscopy
Technical specifications
2D fast trap steering (up to 25 kHz).
Accurate positioning of the individual optical traps with sub-nanometer precision.
Working field: typically 80 μm x 80 μm for a 60X objective magnification).
Optical trap stiffness: 1pN/mW·μm (typ.)
Laser power at sample as high as >0.5 W.
Dimensions of the optical unit (L x H x W): 360 x 250 x 90 mm.
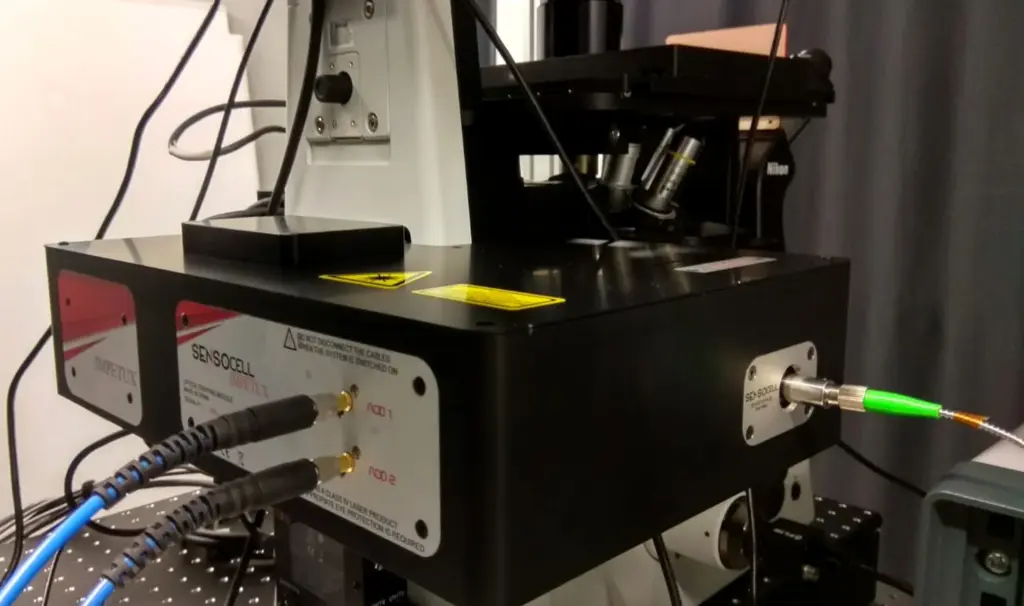
Assembled on Nikon Ti2 inverted microscopes through Epi-FL port.
Detail of SENSOCELL ‘s optical trap generation module installed on a NIKON Ti-2 microscope’s body.
02 / CELL MECHANOBIOLOGY
Force spectroscopy sensor technical specifications
All our systems have been designed with the utmost quality in mind. High reproducibility in the results is provided thanks to the implementation of systematic routines in the operation of the force sensor. The sensors incorporate immersion optics for maximum signal sensitivity, especially when working with small samples or at low powers. The integrated analog and digital electronics, featuring high-resolution A/D converters ensure acquisition fidelity. A careful design guarantees mechanical stability and easy installation.
Dual measurement mode: position calibration through back-plane interferometry and detection of light momentum for single movable traps.
Straightforward installation and tuning routines ensure correct measurements and reproducibility (eyepiece with Bertrand lens incorporated or Centering Scope required).
High Numerical-Aperture (NA=1.4) immersion optics. Optical design optimized for λ=1064 nm.
Maximum laser power at the sample: 300 mW (Check with us different power ranges to fit your needs).
Force resolution <50 fN.
Position resolution: 1 nm (typ.).
Integrated sensor noise over the whole bandwidth <0.1 pN (typ.).
Temperature-compensated, duo-lateral position sensitive detector (PSD) (max. sampling frequency 100 kHz).
Up to 100 kHz, 18-bit, analog-to-digital conversion.
Direct PC communication through Hi-speed USB 2.0 port.
Highly-regulated, low-noise linear power supply (models with 100/120/220/240 VAC- 50/60 Hz available).
Acquisition software and LabVIEW libraries included.
Dimensions of the sensor head (L x H x W): 22 x 18 x 11 cm.
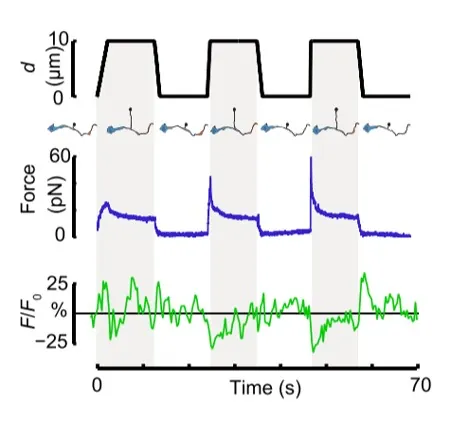
Fig. 1
Time dependence of trap position (top), force signal (middle) and Ca2+ fluorescence signal (bottom) recorded during a membrane tether pulling experiment. The force and Ca2+ ion channel activity signals exhibit negative correlation.
Fig. 2
Force and displacement data for two beads stimulated at frequencies of 4 Hz and 0.25 Hz. The progressive reduction of the beads displacement is in concomitancy with an increase of the applied force and loading rate.
Fig. 1
Schematic representation of the optical tweezers experiment. A fibronectin-coated bead is trapped, brought into contact with the cell membrane and stimulated with oscillations at different frequencies.
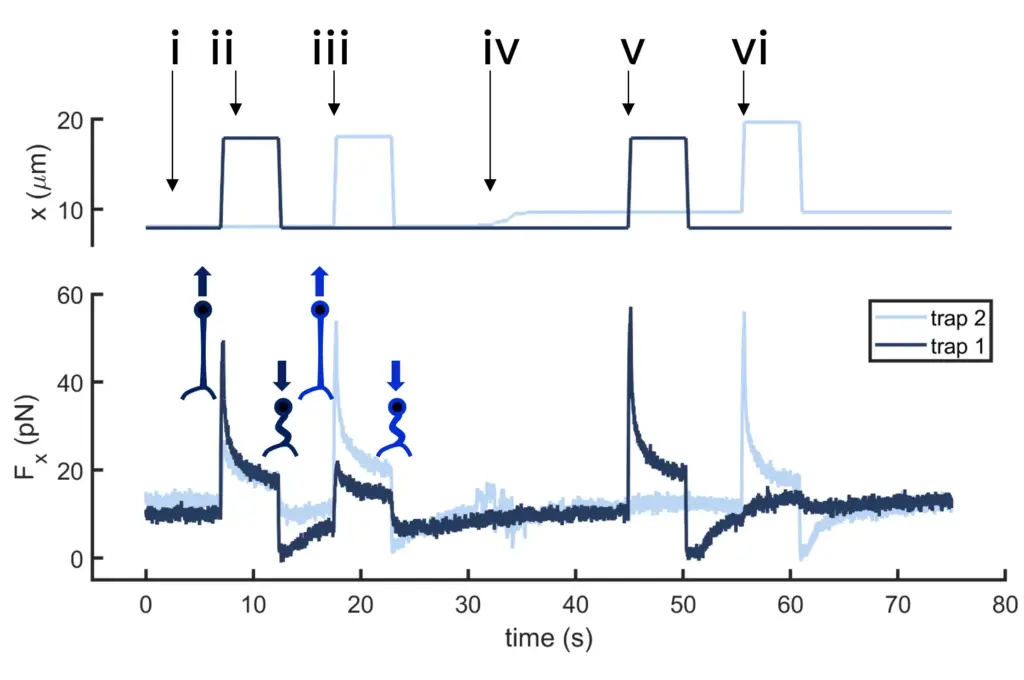
Fig.2
Time dependence of trap 1 and trap 2 position (top) and force (bottom) data along the different steps of the described dual tether pulling experiment.
Fig.1
Confocal video of the described dual tether pulling assay performed on a neuron axon. Courtesy of M. Krieg lab (ICFO).
Fig. 1
Time dependence of trap position (top), force signal (middle) and Ca2+ fluorescence signal (bottom) recorded during a membrane tether pulling experiment. The force and Ca2+ ion channel activity signals exhibit negative correlation.
Video 1
Confocal video showing a DVA neuron Ca2+ ion channel activity in a dynamic optical trapping assay. The pulling rate applied to the membrane tether is progressively increased. Scale bar = 5µm. Acquired at 10Hz.