
Optical tweezers (OT) have been used to study the elasticity of DNA and RNA, protein folding and unfolding, and the activity of molecular motors such as polymerases, helicases, kinesins, and myosins. The forces involved in these processes (~0.1–100 pN) fall squarely within the working range of the technique. In an optical trap, a tightly focused laser beam holds microscopic dielectric particles, such as polystyrene beads, near the focus of the light. By tethering a single biomolecule between two trapped beads, one can apply controlled forces to it and record its mechanical response directly. This avoids the ensemble averaging inherent in bulk methods and reveals individual, transient, and heterogeneous events.
In the experiment shown in the video (Fig. 1), a dual-trap setup held two polystyrene beads in separate optical traps. The 2 µm bead (left) was coated with streptavidin (SA) and the 3 µm bead (right) with anti-digoxigenin antibodies (AD). A 9 kbp double-stranded DNA (dsDNA) molecule was labelled with digoxigenin at one end and with biotin at the other. The AD beads were first incubated with the DNA so that the digoxigenin-labelled ends bound to the antibody. During the experiment, an AD bead carrying DNA was captured in one trap, and an SA bead in the other, and the two beads were brought close enough together for the free biotinylated end of the DNA to bind to the streptavidin. This formed a “dumbbell”: a single DNA molecule tethered between two beads. The DNA was then stretched by moving one trap away from the other while the force on the beads and the distance between them were recorded (Fig. 2). The experiment was performed at 1 M NaCl concentration.
Fig. 2 shows the resulting force–extension curve (FEC), with the DNA extension (1.5–5.1 µm) on the x-axis and the force (0–70 pN) on the y-axis. The red trace, recorded on a single DNA molecule, has three distinct regions, labelled (1), (2), and (3), each reflecting a different mechanical regime. For a 9 kbp molecule in the B-form (0.34 nm per base pair), the expected contour length is about 3.0–3.1 µm, which coincides with the extension at which the force rises steeply.
At low forces (below ~5 pN, extensions up to ~2.5 µm), the DNA behaves as a thermally fluctuating polymer that, in the absence of force, would adopt a random-coil conformation (see Fig. 3). Pulling on it mainly straightens out bends and reduces the number of accessible conformations, so the restoring force is entropic in origin. Because dsDNA is a relatively stiff polymer, with a persistence length of about 45–50 nm, the characteristic force of this entropic elasticity (the thermal energy divided by the persistence length) is only ~0.1 pN, so very little force is needed to extend the molecule considerably. This regime is well described by the worm-like chain (WLC) model.
As the extension approaches the contour length (~3.0 µm), the remaining thermal fluctuations are pulled out and the force rises steeply. Above roughly 10–20 pN, the molecule is essentially straight, and further extension comes from elastic deformation of the double helix itself: stretching of the backbone and small changes in base stacking and helical twist. This enthalpic response is described by the extensible WLC model, with a stretch modulus of about 1000–1500 pN. The steep slope of the curve reflects the high axial stiffness of B-DNA.
At about 62–65 pN, the curve reaches an almost flat plateau, where the molecule lengthens from ~3.0 to ~5.0 µm (about 1.7 times its B-form contour length) with very little increase in force. This overstretching transition is highly cooperative. Depending on the conditions, it can arise from force-induced melting, either by peeling of one strand from free ends or nicks or by the formation of internal melting bubbles, or from conversion to S-DNA, an elongated form in which base pairing is retained. At 1 M NaCl, the high cation concentration screens the electrostatic repulsion between the strands and stabilises base pairing, which suppresses melting and favours the transition to S-DNA. At ~5.0 µm the transition is complete, and the force rises sharply again as the fully converted molecule is stretched further.
The three-bead assay is a single-molecule technique for measuring the mechanical output of individual myosin motors. An actin filament is suspended between two micron-sized beads, each held in a separate optical trap. This bead–filament–bead “dumbbell” is pulled taut under a small pre-tension of a few piconewtons and then lowered onto a third, larger bead fixed to the coverslip. This pedestal bead is sparsely coated with myosin, so that, on average, only one motor at a time can interact with the filament.
When no myosin is bound, the dumbbell undergoes thermal (Brownian) fluctuations whose amplitude is limited by the stiffness of the traps (see Fig. 2). When a myosin head binds to actin, it adds a stiff link to the system and the amplitude of these fluctuations drops sharply; this drop is the signature used to identify individual binding events. The power stroke that follows displaces the filament by a few nanometres, which appears as a step change in the measured force. In the trace shown in Fig. 3, the force rises from the ~4 pN baseline to about 6 pN. When the motor detaches, the traps pull the dumbbell back to its original position and the force drops back to baseline.
The two traps are time-shared by the AODs; the detector signal is sampled at 25 kHz, alternating between traps (12.5 kHz per trap). Hence, the force on each bead is recorded by the photo-sensitive detector (PSD) at a sampling rate of 12.5 kHz per trap. Monitoring both traps gives the tension on the filament from both ends, with enough time resolution to follow individual molecular events. Note that, thanks to the calibration-free force measurements done by the SENSOCELL, one directly measures the force acting on the beads instead of the displacement of the laser over a quadrant photodiode (QPD).
Confocal video of the described dual tether pulling assay performed on a neuron axon. Courtesy of M. Krieg lab (ICFO).
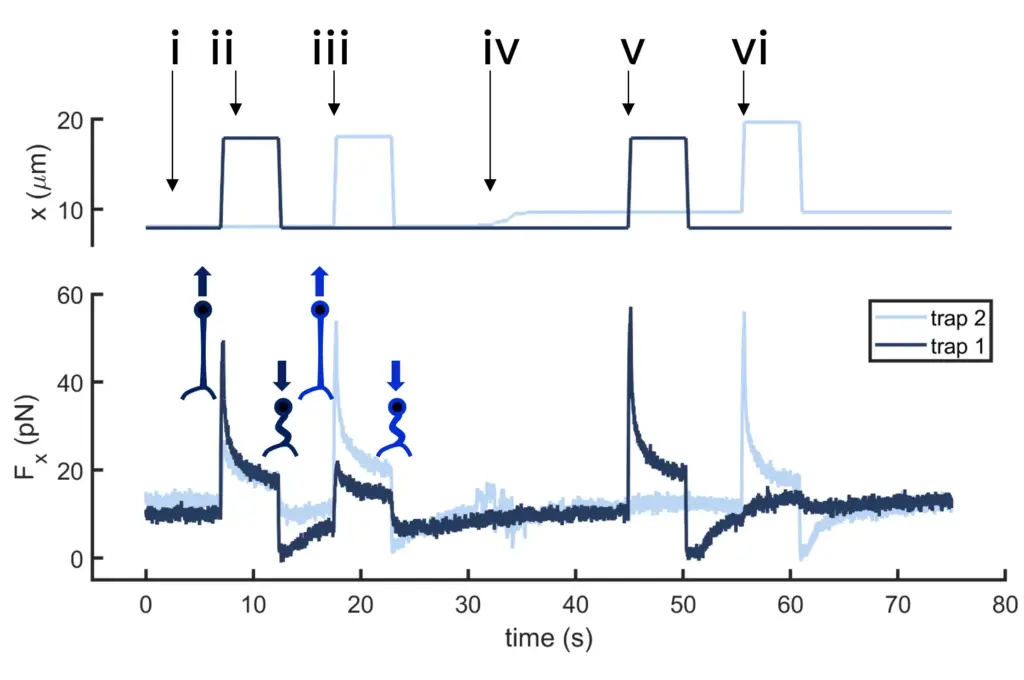
Time dependence of trap 1 and trap 2 position (top) and force (bottom) data along the different steps of the described dual tether pulling experiment.
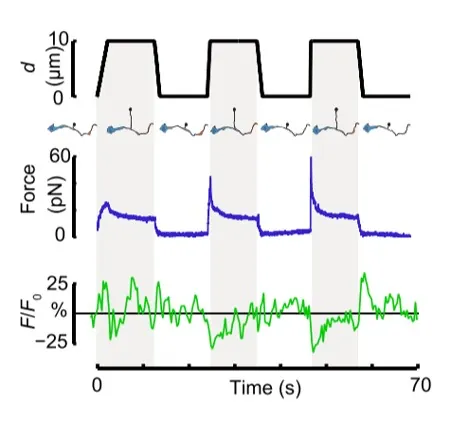
Time dependence of trap position (top), force signal (middle) and Ca2+ fluorescence signal (bottom) recorded during a membrane tether pulling experiment. The force and Ca2+ ion channel activity signals exhibit negative correlation.
Force and displacement data for two beads stimulated at frequencies of 4 Hz and 0.25 Hz. The progressive reduction of the beads displacement is in concomitancy with an increase of the applied force and loading rate.
Schematic representation of the optical tweezers experiment. A fibronectin-coated bead is trapped, brought into contact with the cell membrane and stimulated with oscillations at different frequencies.
Time dependence of trap position (top), force signal (middle) and Ca2+ fluorescence signal (bottom) recorded during a membrane tether pulling experiment. The force and Ca2+ ion channel activity signals exhibit negative correlation.
Confocal video showing a DVA neuron Ca2+ ion channel activity in a dynamic optical trapping assay. The pulling rate applied to the membrane tether is progressively increased. Scale bar = 5µm. Acquired at 10Hz.