BLOG

Measuring forces, deformation and mechanical properties of cell nucleus with SENSOCELL

Measuring forces, deformation and mechanical properties of cell nucleus with SENSOCELL

Measuring the forces applied to the nucleus with SENSOCELL:


Researchers from Institut de Ciències Fotòniques (ICFO) , Centre for Genomic Regulation (CRG), Universitat Pompeu Fabra (UPF) and University of Applied Science Upper Austria have recently published an amazing Science article in where they show that the nucleus, the biggest organelle in the cell, translates cell shape changes into a deformation signal regulating cell behavior.

In this study, our optical tweezers system SENSOCELL has been used to precisely measure the forces applied to the nucleus, determine its deformation and obtain its mechanical properties.

“Our work represents a paradigm shift where the nucleus itself is not simply a static-container of genetic material but rather a dynamic sensor that cells can use to make sense of the environment around them,” says Valeria Venturini the first author of the publication. “The intensity of nuclear stretching predicted the intensity of the response, shedding new light on this ‘fight or flight’ reflex at the single cell level.Understanding this ability to sense deformation, measure it and react accordingly may have important implications in understanding processes like cancer growth and homeostasis.”

You can  review all the  results here ->  Science Publication .

For additional details have a look at our Customer Story.

Finally you will find additional information at

Enjoy the reading!

Congratulations to the authors !
More news:

Fig. 1

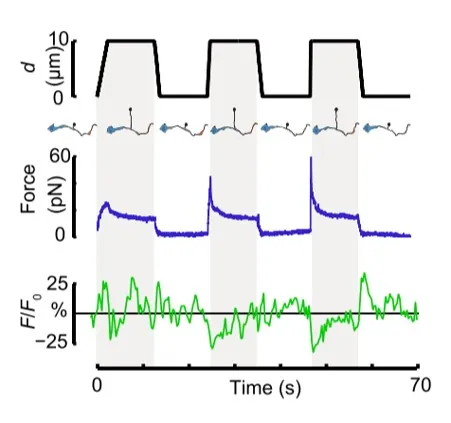
Time dependence of trap position (top), force signal (middle) and Ca2+ fluorescence signal (bottom) recorded during a membrane tether pulling experiment. The force and Ca2+ ion channel activity signals exhibit negative correlation.

Fig. 2

Force and displacement data for two beads stimulated at frequencies of 4 Hz and 0.25 Hz. The progressive reduction of the beads displacement is in concomitancy with an increase of the applied force and loading rate.

Fig. 1

Schematic representation of the optical tweezers experiment. A fibronectin-coated bead is trapped, brought into contact with the cell membrane and stimulated with oscillations at different frequencies.

Fig.2

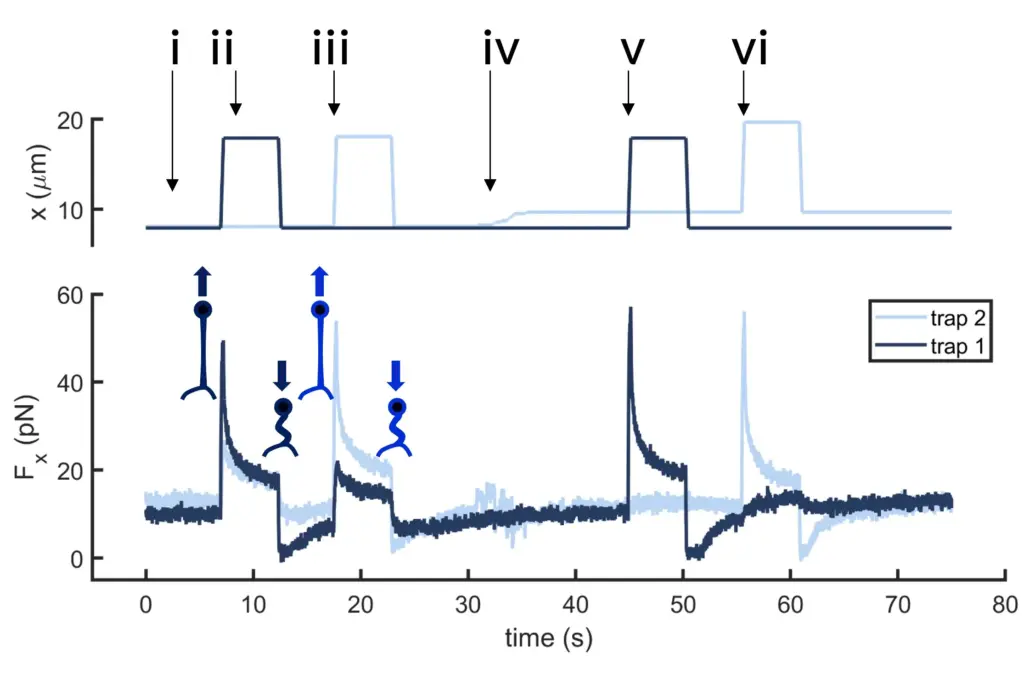
Time dependence of trap 1 and trap 2 position (top) and force (bottom) data along the different steps of the described dual tether pulling experiment.

Fig.1

Confocal video of the described dual tether pulling assay performed on a neuron axon. Courtesy of M. Krieg lab (ICFO).

Fig. 1

Time dependence of trap position (top), force signal (middle) and Ca2+ fluorescence signal (bottom) recorded during a membrane tether pulling experiment. The force and Ca2+ ion channel activity signals exhibit negative correlation.

Video 1

Confocal video showing a DVA neuron Ca2+ ion channel activity in a dynamic optical trapping assay. The pulling rate applied to the membrane tether is progressively increased. Scale bar = 5µm. Acquired at 10Hz.